
PostgreSQL Read Replicas for Application Scaling
A practical guide to using PostgreSQL read replicas safely: what they solve, where lag breaks correctness, and how to route production traffic.
ArmorDB Engineering
ArmorDB engineering
On this page 10 sections
Read replicas are one of the first scaling tools PostgreSQL teams reach for. They can move expensive reads away from the primary, give analysts a safer place to run queries, and reduce the blast radius of reporting traffic. They do not make writes faster, remove the need for indexes, or guarantee that every read sees the most recent write.
That distinction matters because many production incidents start with a well-intentioned replica rollout. A team adds a replica, sends all SELECT traffic to it, and then discovers stale dashboards, broken read-after-write flows, or a replica that falls behind exactly when the primary is already under pressure. The useful question is not whether read replicas are good. It is which traffic belongs on them and how you will detect when they are no longer safe for that traffic.
What a PostgreSQL read replica actually does
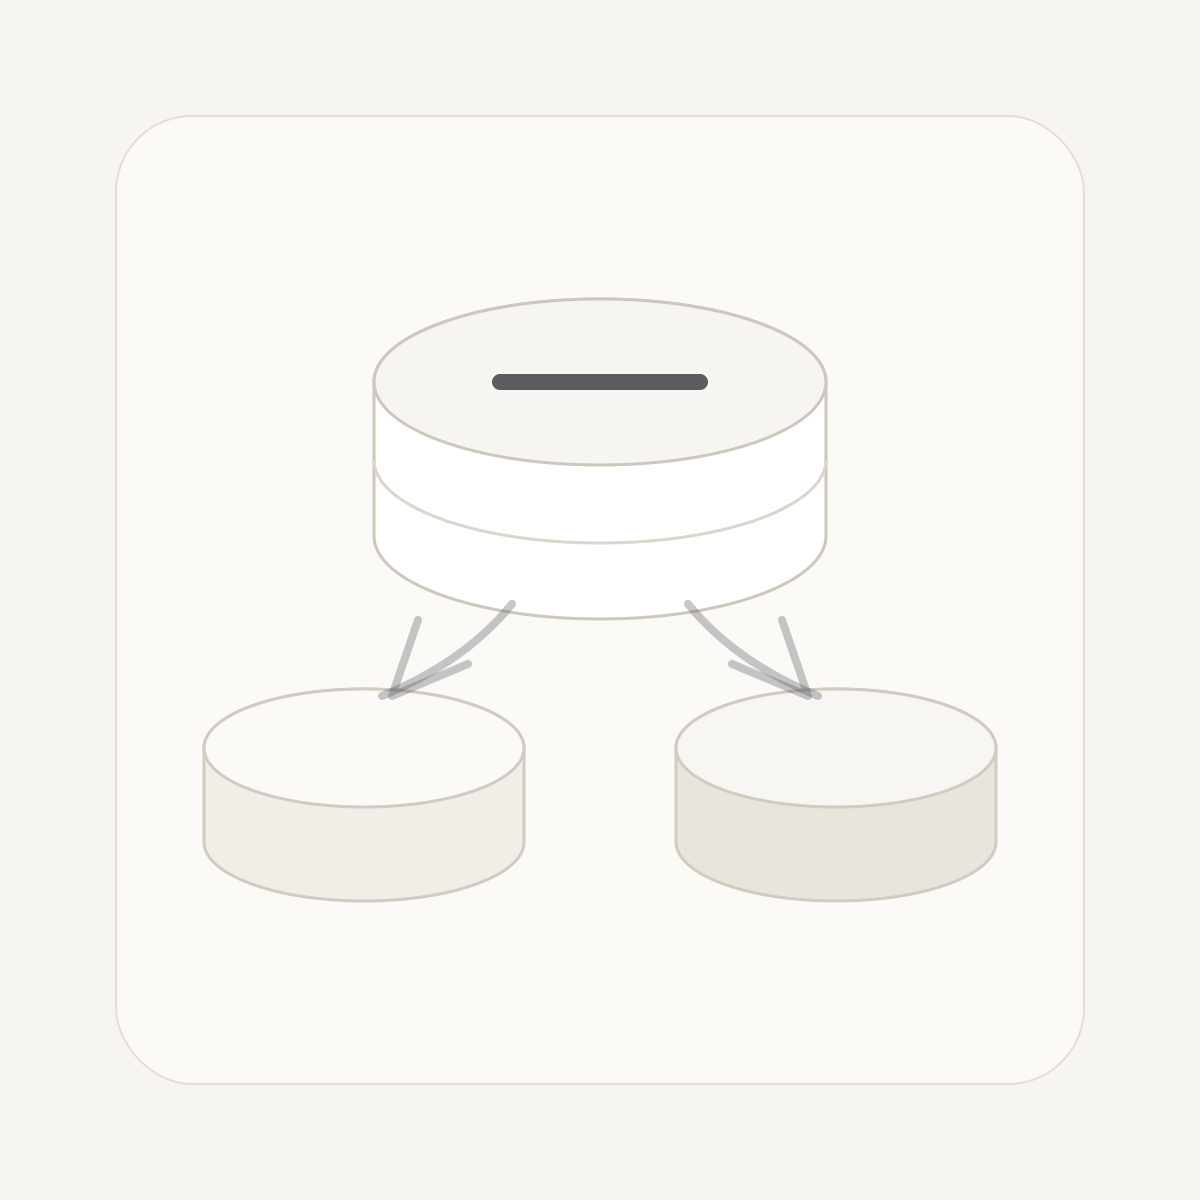
In a common PostgreSQL setup, the primary accepts writes and streams write-ahead log records to standby servers. PostgreSQL's streaming replication documentation describes this as log-shipping replication: standby servers receive WAL records and replay them so their copy of the database follows the primary. With hot standby enabled, a standby can accept read-only queries while it is replaying WAL.
That architecture is powerful because it keeps the write path simple. The primary remains the source of truth, and replicas are eventually consistent copies. It also means replicas inherit physical database changes rather than running a separate application-level sync job. Schema changes, index builds, row changes, and transaction visibility move through WAL replay.
The tradeoff is that a standby is not a second writable primary. PostgreSQL hot standby is explicitly read-only for ordinary SQL writes. A replica can answer SELECT queries, but it cannot safely process application writes unless you are using a separate multi-primary or logical architecture with very different failure modes. For most SaaS applications, read replicas are best treated as a routing and isolation feature, not as a write-scaling feature.
The workloads that fit replicas best
Read replicas work best when the query can tolerate a small delay and when the result does not immediately affect a user-facing write decision. Analytics pages, customer export jobs, internal admin searches, long-running reports, and background reconciliation queries are usually good candidates. These queries often consume CPU, memory, or I/O in bursts. Moving them to a replica protects the primary from work that is important but not latency-critical for the write path.
They are more dangerous for flows that require read-after-write consistency. If a user creates a project and the next request reads from a lagging replica, the application may appear to lose the project for a few seconds. If a checkout flow writes an order and then reads inventory or payment state from a replica, stale data can become a correctness bug rather than a cosmetic delay. These flows should usually read from the primary, use an explicit consistency check, or delay replica reads until the application can prove that the replica has caught up enough.
| Workload | Good replica candidate? | Why |
|---|---|---|
| Internal reporting dashboard | Usually yes | Stale-by-seconds data is often acceptable, and isolation protects the primary. |
| User reads immediately after creating or editing data | Usually no | Replica lag can make successful writes appear missing or reverted. |
| Background export or CSV generation | Yes, with limits | It can be isolated from primary latency, but large scans still need timeouts. |
| Authorization, billing, and inventory checks | Usually no | Stale reads can become security or money-impacting correctness bugs. |
| Search pages over mostly stable data | Sometimes | Works if the product accepts freshness delay and handles lag explicitly. |
The table is intentionally conservative. A replica strategy that starts with fewer routed queries is easier to reason about than one that sends every SELECT away from the primary and then tries to patch consistency failures one by one.
Lag is the core operational constraint
Replica lag is not a single number with one cause. A standby can fall behind because the network is slow, because the primary is generating WAL faster than the standby can receive it, because the standby has insufficient I/O to replay changes, or because queries on the standby conflict with WAL replay. PostgreSQL exposes replication state through views such as pg_stat_replication on the primary and WAL receiver information on the standby. The exact fields vary by version, but the operational goal is stable: know whether WAL is being sent, received, flushed, and replayed in time for the traffic you route there.
Lag also tends to show up during the moments when it hurts most. Bulk imports, migrations, index creation, batch updates, and sudden write spikes all increase the amount of WAL a replica must process. A replica that is fine during normal traffic can become unsafe during a migration window. That is why replica routing should be tied to operational state rather than being a permanent assumption in application code.
For application owners, the most useful policy is to define a maximum acceptable replica age per workload. A dashboard might tolerate 30 or 60 seconds. A customer-facing page might tolerate only a few seconds, or none at all. If the replica is older than that threshold, the application should either read from the primary, show a freshness warning, or defer the job. Silent stale reads are the worst default because they look like normal success.
Query conflicts and long-running reads
Hot standby lets replicas answer read-only queries, but standby queries can conflict with WAL replay. PostgreSQL documents several types of conflicts, including cases where replay needs to remove or change row versions that a standby query still needs. When that happens, PostgreSQL may cancel the standby query so the replica can keep replaying WAL. If the system instead allows long standby queries to delay replay for too long, lag grows and the replica becomes less useful for freshness-sensitive work.
This is where replicas are often misunderstood. A read replica is not an unlimited reporting warehouse attached to production. It still has CPU, memory, cache, and I/O limits, and it still has to keep up with WAL replay. If a BI query scans large tables for minutes, it can compete with replay and with other replica reads. Good replica usage includes statement timeouts, pagination, covering indexes for common reports, and separate expectations for operational dashboards versus ad hoc analysis.
Some teams use a dedicated analytics replica with more relaxed freshness and stricter query controls. Others keep application replicas for low-latency read traffic and move heavy analytics to a warehouse or scheduled export pipeline. The right choice depends on how stale the data may be and how much load the primary can safely generate for downstream systems.
Routing patterns that avoid surprises
The simplest routing model is explicit: the application has a primary connection pool and one or more replica pools. Code chooses the primary for writes and consistency-sensitive reads, and chooses a replica only for named read paths that tolerate lag. This is less magical than automatic splitting, but it is easier to audit. When a bug appears, you can inspect the specific route instead of reverse-engineering what a proxy decided.
Connection strings can help in some environments. libpq supports target_session_attrs values that allow clients to prefer or require a read-write server, which is useful when connecting through a list of hosts after failover. That is different from deciding which application query should use a replica. The driver can help find a suitable server, but the application still owns the consistency contract for each request.
A practical managed PostgreSQL setup usually combines explicit pools with health checks. The primary pool is used for transactions, writes, migrations, and read-after-write flows. Replica pools are used for specific background jobs and endpoints. A small routing layer checks replica availability and lag before handing out a replica connection. If the replica is missing, stale, or failing, the route either falls back to the primary or returns a controlled retry depending on how expensive the query is.
How to roll out replicas safely
Start by measuring before routing. Identify the top read queries by duration and total time, then decide which ones can be stale. Add indexes or query fixes first when the query is simply inefficient; a replica should not be a way to multiply bad query plans. Once you have a candidate, route one job or endpoint to the replica and watch primary load, replica CPU, replay lag, query latency, and cancellation rates.
During the first rollout, keep the fallback behavior boring. If the route serves an internal dashboard, a clear stale-data warning may be better than falling back to the primary and recreating the same load you were trying to isolate. If the route serves a customer page, falling back to the primary may be the right choice because correctness matters more than preserving replica isolation. The policy should be explicit enough that an on-call engineer can predict what happens when the replica is 90 seconds behind.
Migrations deserve special handling. Before large backfills or bulk imports, assume replicas may lag. Avoid introducing a new read route to a replica at the same time as a write-heavy migration. If an application deploy depends on reading newly written rows, keep that path on the primary until the migration is complete and the replica has caught up. For schema changes, remember that replicas replay the same database changes; application versions that depend on a new column or index still need normal deploy sequencing.
Monitoring checklist for production
A useful replica dashboard focuses on freshness, capacity, and application impact. Freshness tells you whether the standby has replayed WAL recently enough for its workload. Capacity tells you whether CPU, memory, disk I/O, and storage are leaving enough headroom for replay and reads. Application impact tells you whether queries routed to the replica are timing out, being canceled, or falling back to the primary more often than expected.
Do not monitor only uptime. A replica can be up and still be too stale for the application. It can also be perfectly fresh while serving slow queries because the workload lacks the right indexes. The dashboard should connect database signals to user-visible behavior: report generation time, dashboard freshness labels, background job retries, and primary fallback volume.
| Signal | What it tells you | Useful response |
|---|---|---|
| WAL replay delay or last replay timestamp | Whether data is fresh enough for routed reads | Stop routing freshness-sensitive traffic when the threshold is exceeded. |
| Standby query cancellations | Whether reads are conflicting with recovery | Shorten queries, add indexes, or move heavy analysis elsewhere. |
| Replica CPU and I/O saturation | Whether the standby can both replay and serve reads | Reduce routed load or choose a larger replica. |
| Primary fallback rate | Whether replica routing is silently shifting load back | Alert before fallback hides a replica problem and overloads the primary. |
| Long-running replica queries | Whether reporting is monopolizing the standby | Add timeouts and split large jobs into bounded chunks. |
These signals are also useful when comparing managed PostgreSQL providers. Ask how replica lag is surfaced, whether failover changes connection endpoints, how many replicas are supported, and whether backups, pooling, and replicas interact in documented ways. On ArmorDB, PgBouncer and managed PostgreSQL plans are designed to keep the common application path simple; if replicas are part of your growth plan, pair them with the same discipline you use for backups and connection limits.
Common mistakes
The most common mistake is treating replicas as a free performance multiplier. If the primary is slow because a query needs a better index, copying that query to another server may only defer the incident. Fix the query first, then use replicas to isolate the remaining legitimate read load.
Another mistake is hiding replica selection too deeply inside an ORM helper. It is convenient to say read operations go to replicas and writes go to the primary, but real applications have many reads that are part of a write workflow. Password reset flows, billing screens, invite acceptance, and permissions checks often look like reads in code while requiring current data. Those paths should make the consistency requirement visible.
Finally, avoid failover assumptions that no one has tested. After a primary failover, old replicas may need to reconnect, connection pools may hold stale sessions, and clients may need to rediscover the read-write endpoint. Practice the application behavior, not just the database failover procedure.
Takeaway
PostgreSQL read replicas are excellent for isolating read-heavy, freshness-tolerant work from the primary. They are not a substitute for indexing, not a write-scaling mechanism, and not a guarantee of current data. The safest strategy is explicit routing, clear freshness thresholds, conservative rollout, and monitoring that treats lag as an application correctness signal.
If you are still deciding whether replicas are the right first scaling move, start with query tuning and connection management. ArmorDB's guides on /blog/postgresql-connection-pool-sizing and /docs/pgbouncer are useful companions because a healthy primary connection pattern makes replica decisions much easier.
Sources and further reading
- PostgreSQL documentation: Warm Standby and Streaming Replication, https://www.postgresql.org/docs/current/warm-standby.html
- PostgreSQL documentation: Hot Standby, https://www.postgresql.org/docs/current/hot-standby.html
- PostgreSQL documentation: Monitoring replication with pg_stat_replication, https://www.postgresql.org/docs/current/monitoring-stats.html#MONITORING-PG-STAT-REPLICATION-VIEW
- PostgreSQL documentation: Replication configuration, https://www.postgresql.org/docs/current/runtime-config-replication.html
- PostgreSQL documentation: libpq connection parameter target_session_attrs, https://www.postgresql.org/docs/current/libpq-connect.html#LIBPQ-CONNECT-TARGET-SESSION-ATTRS
Written by ArmorDB Engineering
Practical notes on PostgreSQL operations, security, and infrastructure decisions for teams building production applications.
Updated Jul 13, 2026
Keep exploring
Related reading
Deep Dives · 8 min read
PostgreSQL Replication Lag in Managed Databases: A Practical Guide
Learn how PostgreSQL replication lag happens, how to read the right metrics, and how to design safer read routing, alerts, and failover runbooks for managed databases.
Read articleDeep Dives · 8 min read
PostgreSQL Memory Tuning in Managed Databases: A Practical Deep Dive
A practical guide to PostgreSQL memory tuning for managed databases, covering work_mem, shared buffers, temp files, connection pools, and safe diagnosis.
Read articleDeep Dives · 9 min read
PostgreSQL Transaction ID Wraparound in Managed Databases: A Practical Deep Dive
Learn how PostgreSQL transaction ID wraparound happens, how autovacuum prevents it, what to monitor, and how to respond before production is at risk.
Read article